Our Survey Said...
A tool to capture customer or employee feedback, through a set of structured question types.
For my final project, I wanted to focus more on creating something that would be of use in a business setting. I settled on a survey application that could be used either for an organisation’s internal employees, or with their clients. Built on a Rails API using a PostgreSQL database and JWT token authentication, the front-end uses AngularJS and Bootstrap running as a separate application on the Express framework to provide the user interface.
Whilst small in the overall development process, the part that pleased me most, was discovering a way of setting the Y-axis on the Angular-Charts pie-chart I was using; as far as I’ve been able to make out, this was previously undocumented, at least until I posted it on StackOverflow. If I was doing the application again, I’d want to expand it out to encompass organisations and the structures within them. I think I’d also want to find myself a tame designer…
Project Aims
- Build a business focused application using a Ruby-on-Rails API and an AngularJS client app
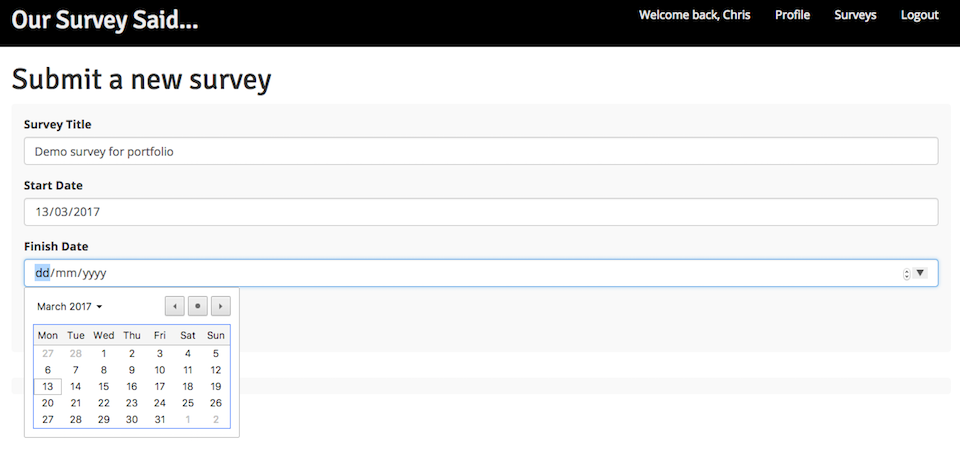
- Give an app user the ability to create a new survey containing a variety of question types
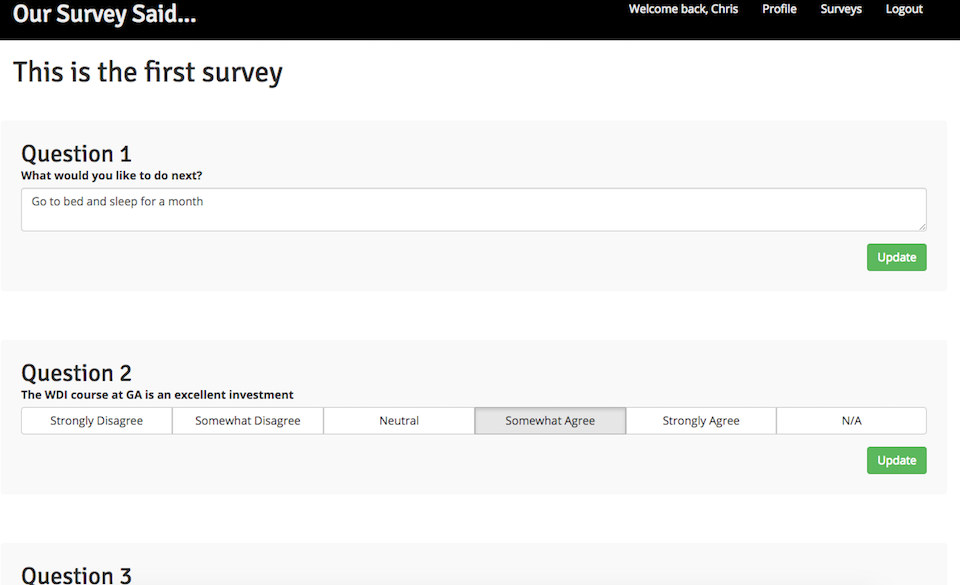
- Allow users to select and respond to a survey
- Give the originator of the survey the ability to see the results of their survey and to present this in a digestible form
Technologies Used
- HTML
- CSS/SASS
- Bootstrap
- AngularJS
- Express.js
- Ruby on Rails
- PostgreSQL
- ActiveRecord
- JWT token authentication
- Gulp
- Babel
Successes
- The database structure, whilst apparently simple in concept, was a little trickier to set up than initially imagined, but in the event worked well for the purposes of the apparently
- Solving the issue of how to zero-base the Y-axis of the pie-charts
Challenges
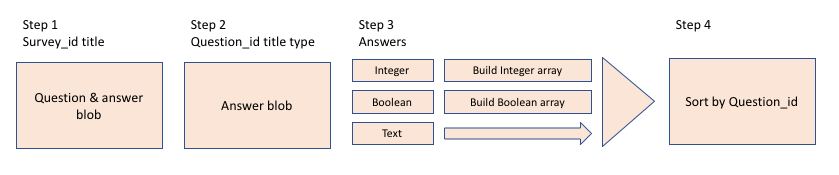
- Given the way in which the data for survey responses builds up in the database, being able to sort them into a usable order was one of the biggest challenges - the problem is represented in the graphic below
- Understanding the complexities of dealing with wholly separate client and API applications, whilst switching between AngularJS and Ruby-on-Rails
- Angular-Charts proved to be tricky to get installed correctly and operational
Future Development
- Expand the data structures out to encompass ‘organisations’ and the ‘groups’ within them
- Enhancements to the range and scope of the question types
- Ability to present surveys to specific individuals, or groups of individuals
- Email circulation of links to surveys
- Add notifications system into app
- Wholly divorce answer data from the user that provided it - privacy requirement
Live Version
- a live version of the app can be found on Heroku at ‘Our Survey Said’
- The code for the app can be located on ‘GitHub’ - ‘WDI_PROJECT_4 - client’
- The code for the app can be located on ‘GitHub’ - ‘WDI_PROJECT_4 - api’
- To get started, register on the site as a new user, create a new survey, then select one or more question types, provide a suitable question and click ‘Save Question’